Kenya’s Electricity Demand
Kenya’s Electricity Demand
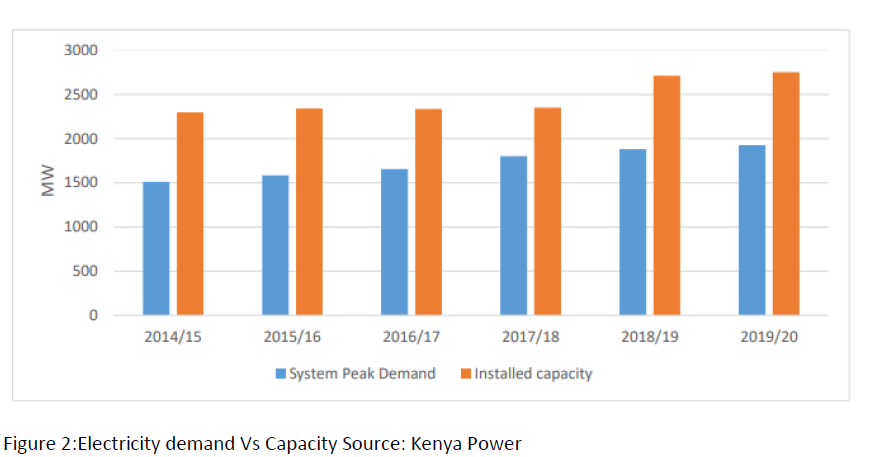
The nation has seen an upward trend in demand for electricity over the past decade. The peak demand increased from 1,512MW in FY 2014/15 to 1,926MW in FY 2019/20. Despite the rampaging COVID-19 pandemic, a new peak of 1976MW was realized in the month of December 2020. The trend in peak demand growth for the period 2014/15-2019/20 is shown in Figure 2.
The country has also experienced a significant increase in the number of customers 14 connected to the grid, rising from 3,611,904 recorded in financial year 2014/15 to 7,576,145 recorded in financial year 2019/20, of which rural connections were 1,502,943, accounting for 20% of total connections. This is an annual average growth rate of 19.14% is attributed to accelerated electrification programs implementation across the country;
Electricity transmission and distribution
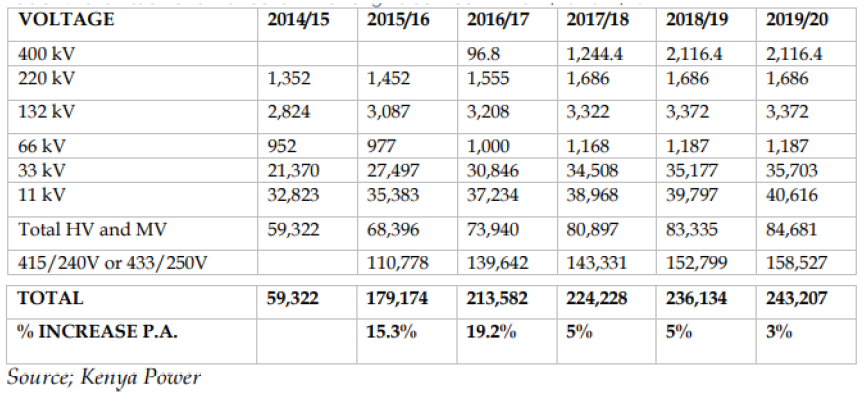
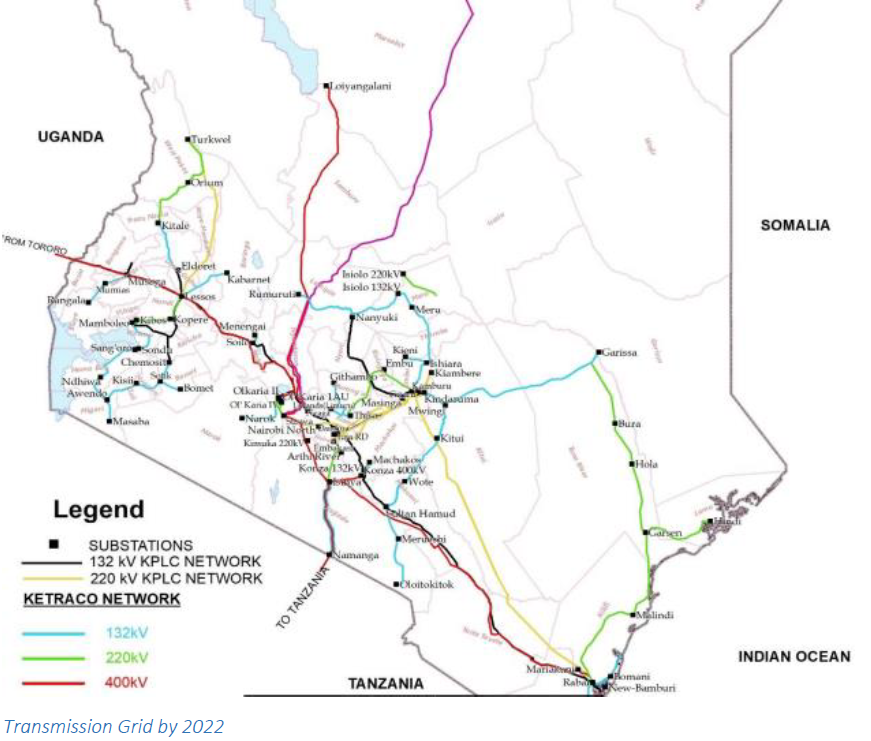
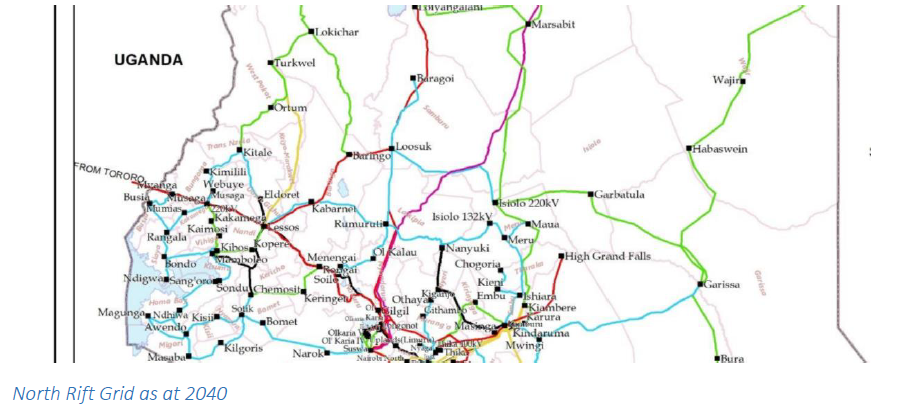
The total length of the Transmission and distribution network was 243,207 kilometers for all voltage levels in 2019/20 compared to 59,322 kilometers in 2014/15. This growth has been greatly influenced by Kenya Electricity Transmission Company (KETRACO), who have accelerated the development of transmission infrastructure within their mandate, consisting of 132kV, 220kV and 400kV. Table 1 provides transmission and distribution line lengths between FY 2014/15 and 2019/20.
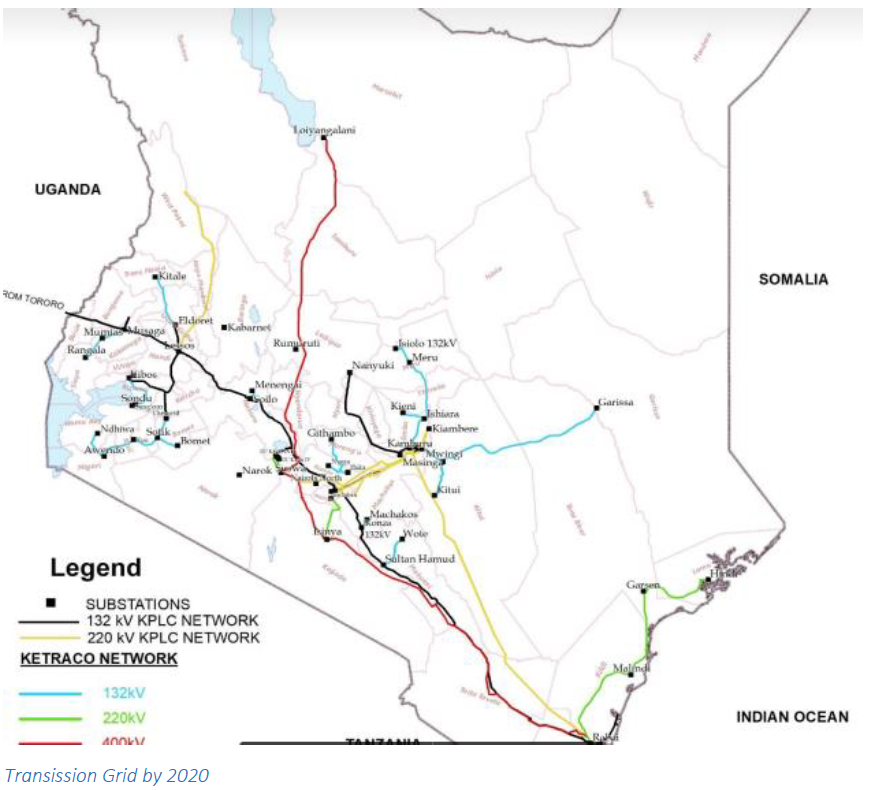
The total transmission network (400kV, 220kV, 132kV) stood at 7,174.35 kms by June 2020. The entire national interconnected electricity distribution network is under KPLC and stood at 243,207 in 2019/20. The distribution network consists of 66 kV feeder lines and 33kV and 11kV medium-voltage lines and 415/240V LV lines distributed across the country. There are plans to construct additional distribution lines and establish new substations to extend power supply in rural areas. The end goal is to attain universal access as soon as is practically possible. Projects and programs are also being implemented to reduce system losses and improve system reliability.
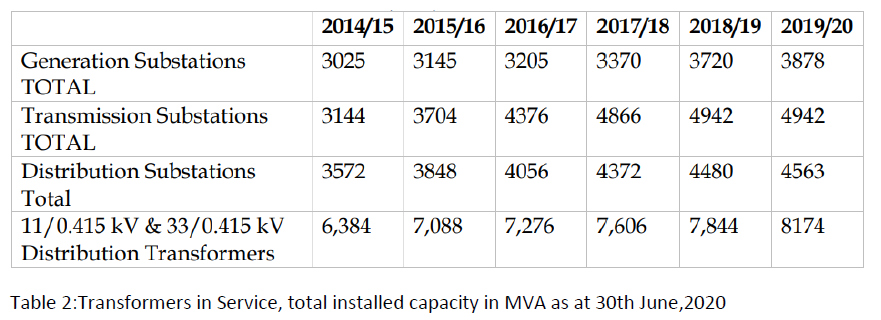
Generation sub stations expansion was significant for the review period, rising from 3,025MVA in 2015 to 3,878MVA in 2020. During the same period, transmission substation capacity expanded from 3,144MVA to 4,942MVA while distribution sub-stations capacity increased from 3,572MVA in 2014/15 to 4,563MVA in 2019/20 FY. Distribution transformer capacity significantly increased during the same period from 6,384MVA to 8,174MVA. Table 2 represents the transmission and distribution substations capacities for the period under review.
Existing power grid/ Sources
The power generation mix comprises of 45.6% of geothermal, 36.2% hydro, 6.7% fossil fuels, 9.6% wind and 0.8% from solar as at the end of the financial 2019/20. Figure 4 shows the evolution of the generation mix from 2017/18 to 2019/20.
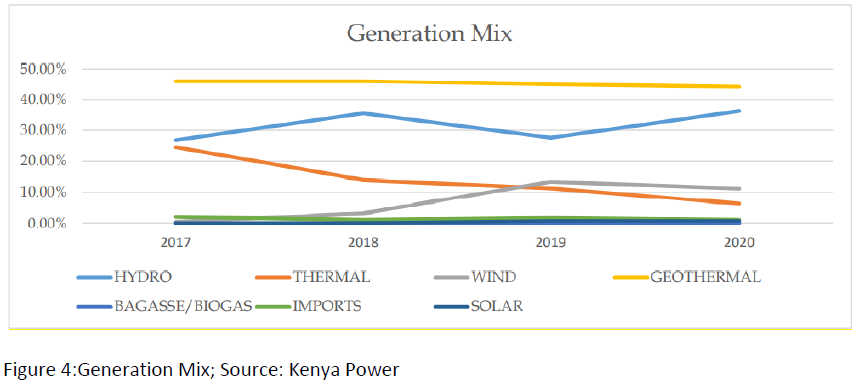
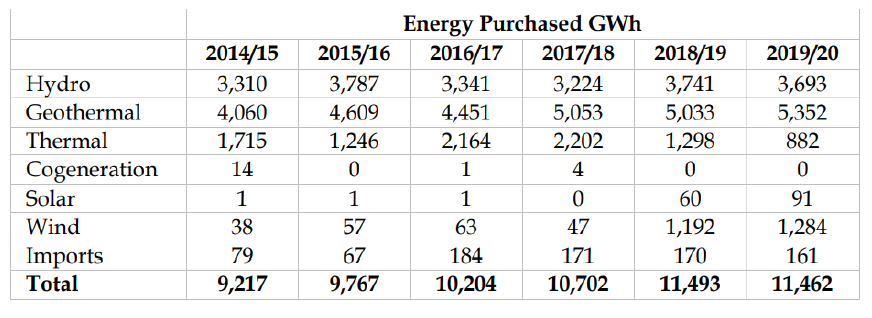
The FiT policy acceptance by IPPs and deliberate government policy to advance renewable energy generation has led to continuous decline in energy purchased from conventional thermal power plants. Energy purchased from the thermals reduced to 882 GWh in FY 2019/20 from 2,202 GWh in FY 2017/18. Energy purchases from Wind and Solar increased considerably from FY 2018/19 with 1,284 GWh and 91 GWh purchased in the year 2019/20, respectively as summarized in Table 3.
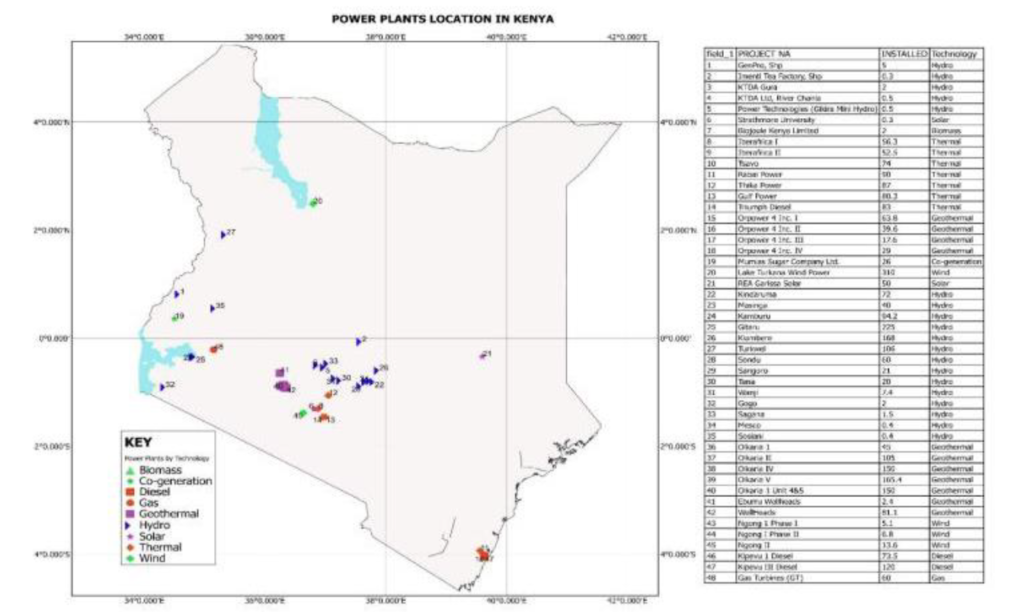
The location of power plants in the country are as depicted in Figure 5. The figure shows that most plants in the country are located in the geothermal-rich Olkaria belt in Rift Valley with hydro plants largely located in the Tana Cascade. In recent years, other technologies are emerging with wind and solar having the best prospects. Wind plants are already developed in Corner Baridi in Rift Valley as well as the famous Lake Turkana wind in Marsabit.
